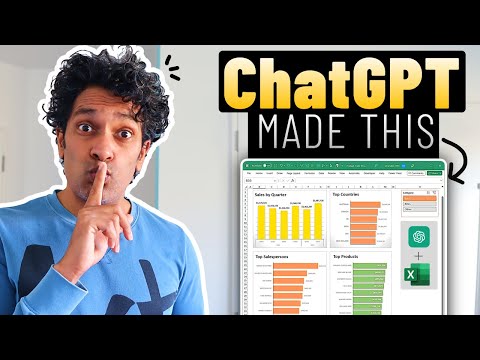
ChatGPT can change the way you look at data and analyze it. Recently, I asked ChatGPT to help me build an Excel dashboard and the result was AMAZING. In this video I explain the process and show case the results.
💬 See the ChatGPT prompts & conversation here 👇
https://chat.openai.com/share/e2e95818-0813-4330-9586-7c5d428922f3
📂Sample Data
Here is the sample data I used for this example. https://chandoo.org/wp/wp-content/uploads/2023/07/chatgpt-made-this-sample-data.xlsx
⏱ In this video
=============
0:00 – ChatGPT + Excel intro
0:30 – Asking ChatGPT how to analyze the data
2:16 – Sales by Quarter Pivot Table & Chart
4:34 – Making the dashboard “interactive”
6:30 – Creating “Top 10” instead of all
8:07 – Taking it to NEXT Level 🚀
🤖More AI with Data Videos
========================
Check out the AI + Data Playlist. – https://www.youtube.com/playlist?list=PLmejDGrsgFyBh9sO5sD_PY9nZblKjfFX5
If you have some topic suggestions on AI + Data, leave a comment.
The ChatGPT Pivot Jokes 😂
=======================
1) Why did the pivot table join a gym?
Because it wanted to stay in shape and keep its columns and rows well-toned!
2) How did the pivot table solve its problems?
It simply pivoted them away!
3) Why did the pivot table bring a ladder to the party?
Because it wanted to get a higher perspective on the data and rise above the rest!
~
#chatgpt #excel


