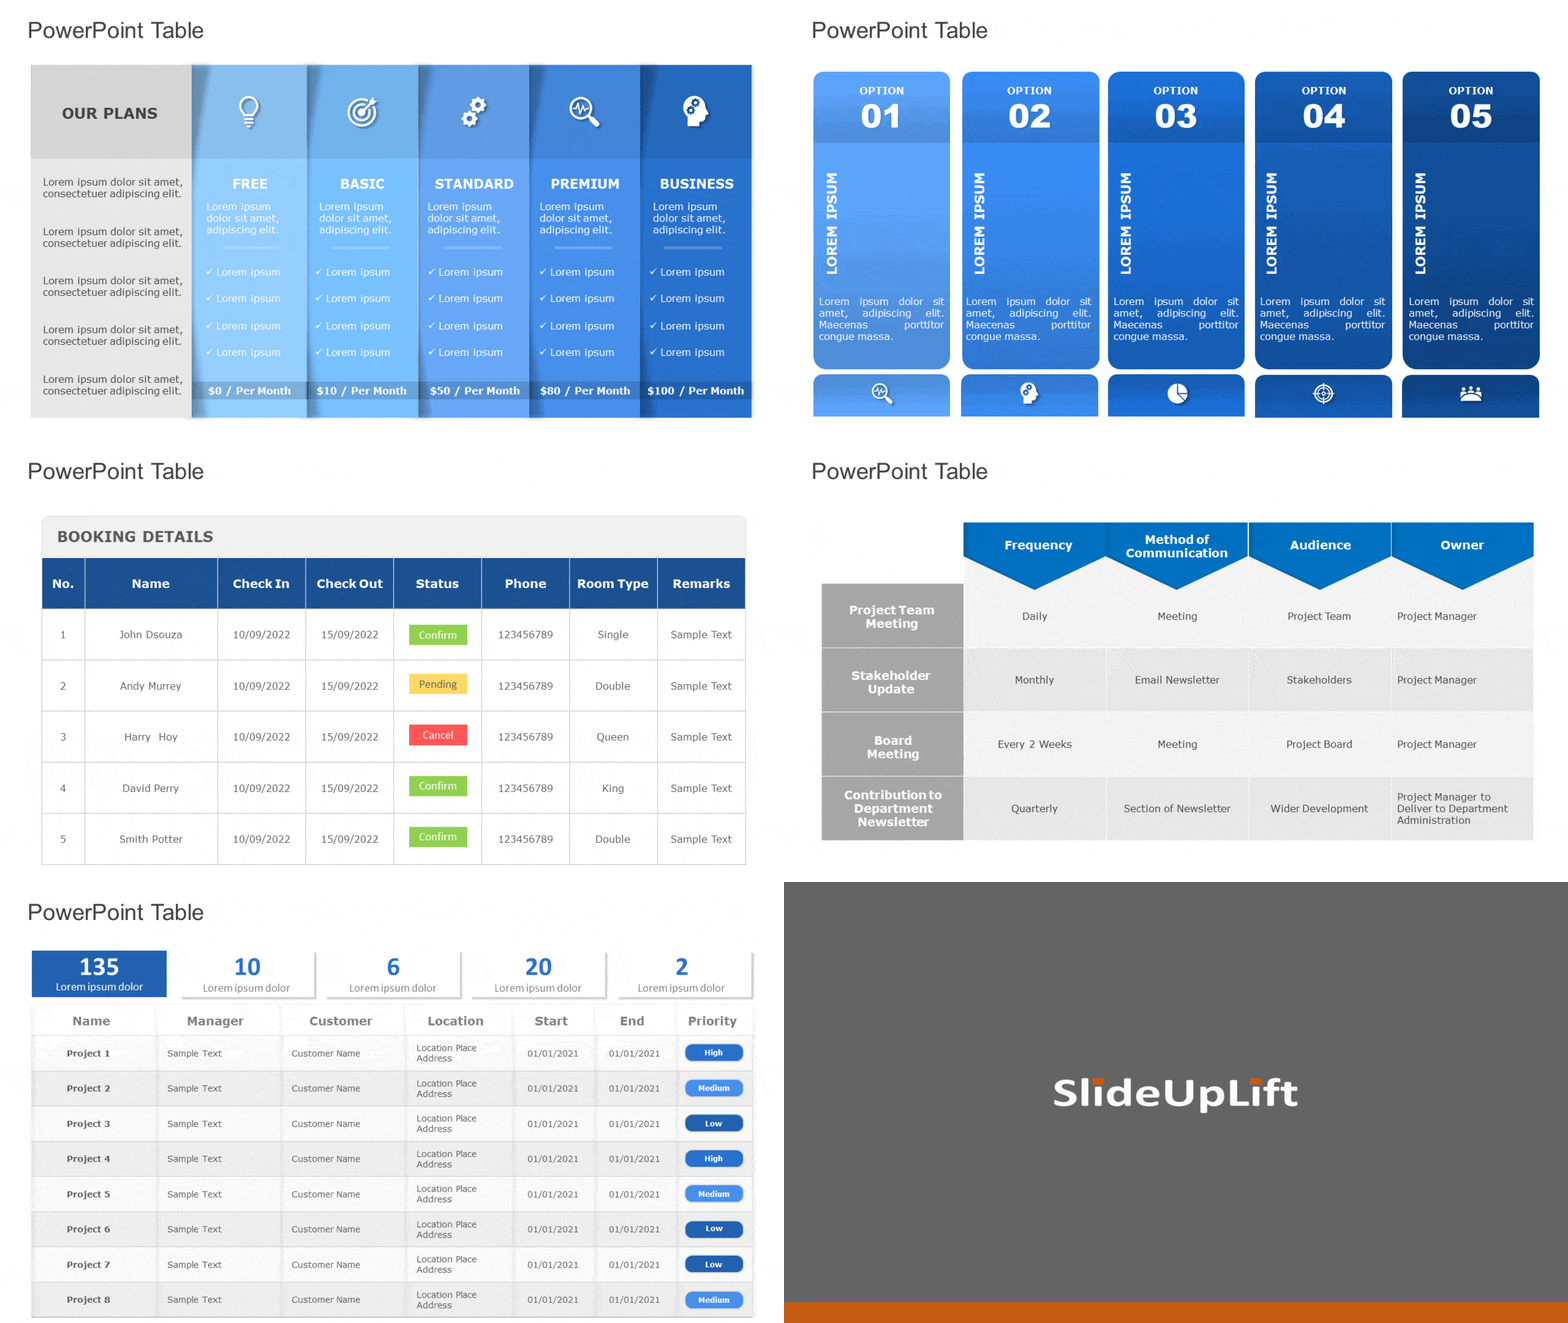
Tables are an essential element of any presentation, as they allow you to organize and present data in a clear and concise manner. Whether you’re creating a business presentation, a school project, or a personal slideshow, learning how to make a table in PowerPoint is a valuable skill to have.
In this blog, we’ll go through the steps to create a table from scratch, as well as cover some steps for formatting and customizing your table to make it look its best. So if you’re ready to learn how to make table in PowerPoint, let’s get started!
If you are a Google Slides user, then check out our article about formatting tables in Google Slides.
What is a table in PowerPoint and why is it useful?
A table is like a neatly organized collection of information divided into convenient rows and columns. Tables are used to display information in a clear and organized manner, making it easy for readers to understand and compare data. Tables can be used to present a variety of information, including statistical data, financial reports, product comparisons, and more.
There are several reasons why tables are useful
- They allow for a clear and organized presentation of data: Tables make it easy to present large amounts of data in a clear and organized manner. Each piece of data is given its own cell, and the rows and columns of the table help to separate and organize the information.
- They make it easy to compare data: Tables allow readers to easily compare different pieces of data, as all of the information is presented in a consistent format.
- They allow for efficient data entry: Tables make it easy to input and edit data, as each piece of information is given its own cell.
- They can be easily formatted and customized: Tables can be easily formatted and customized to fit the specific needs of your presentation. You can adjust the font size, font color, cell borders, and more to create a table that looks professional and visually appealing.
Overall, tables are a useful tool for presenting and organizing data in a clear and organized manner.
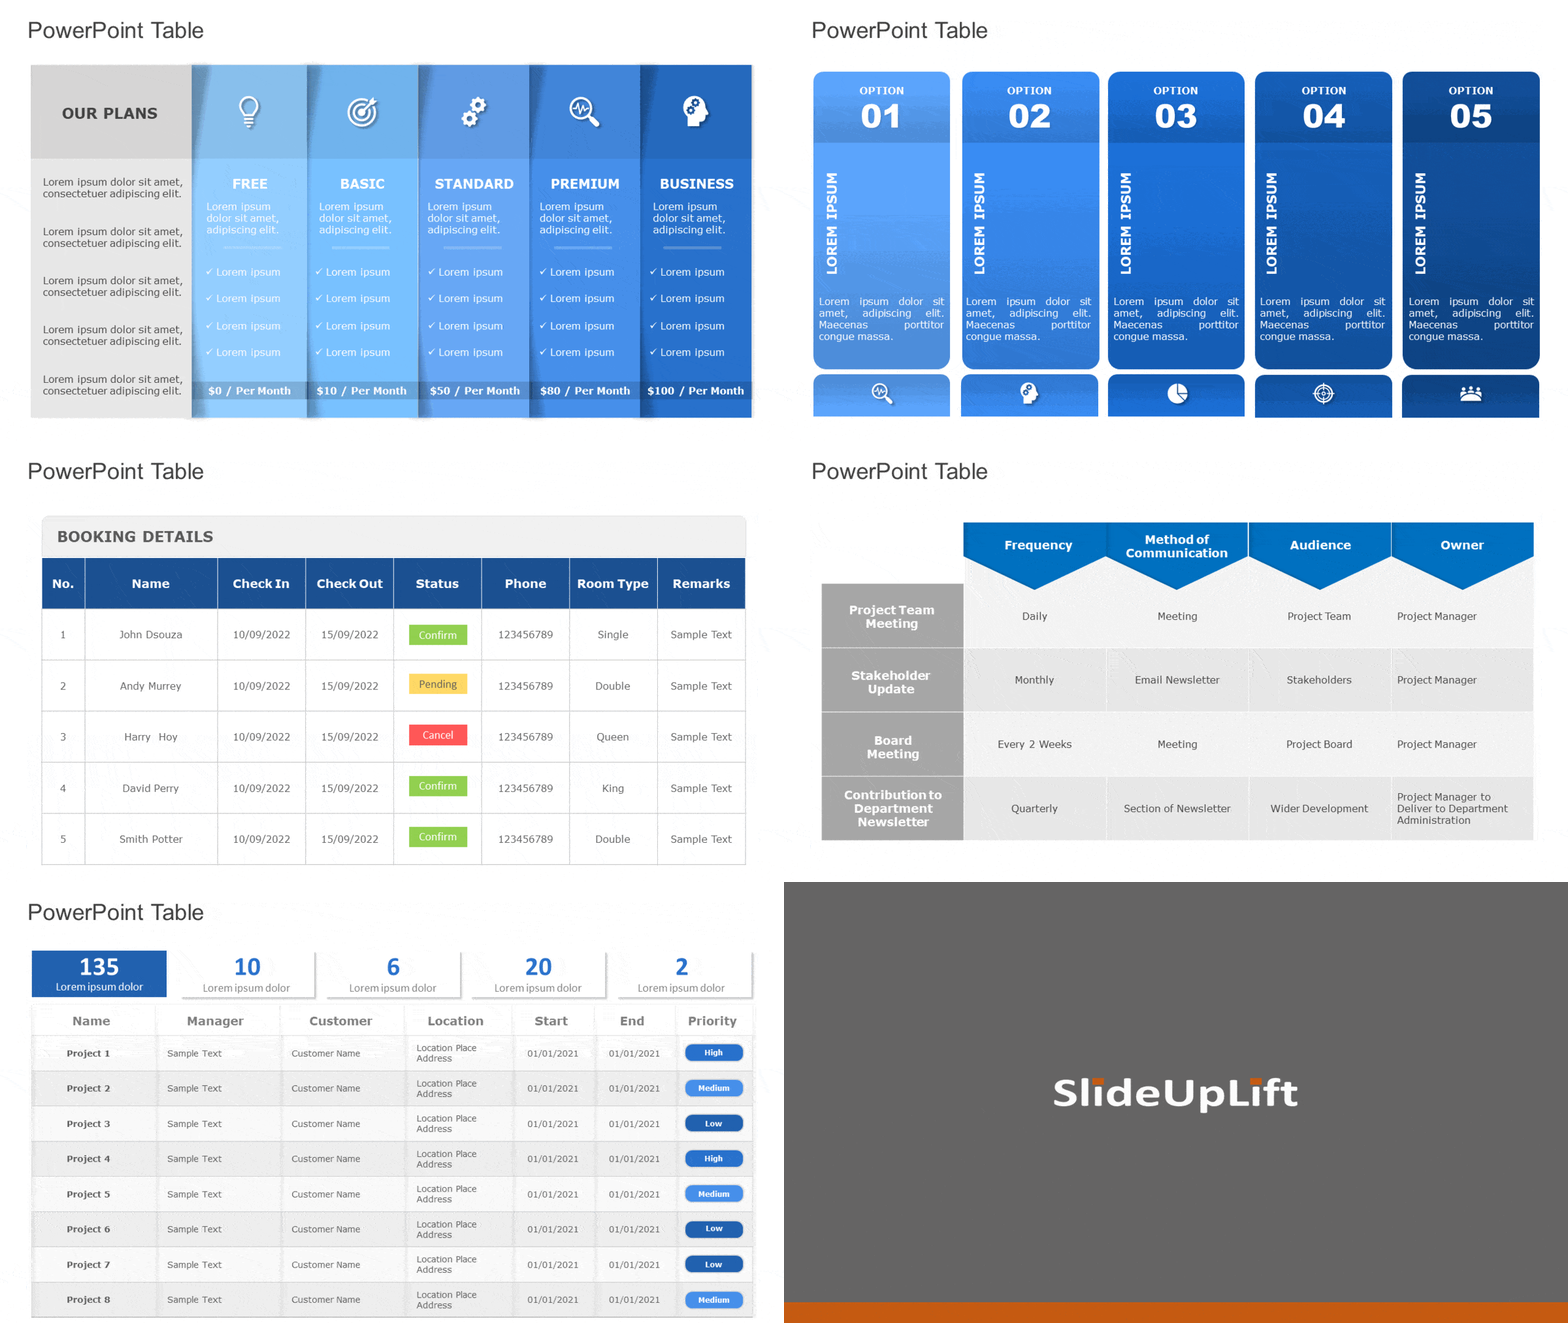
Try Our Editable PowerPoint Tables
To Organize Your Presentation Data
How to create a table in PowerPoint?
To insert table in PowerPoint, follow these steps:
Step 1: Open the PowerPoint presentation and select the slide where you want to add the table.
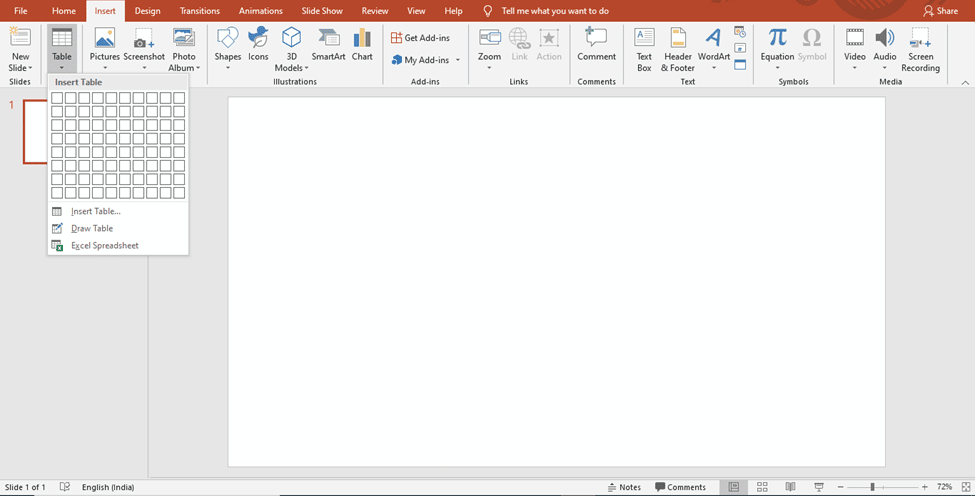
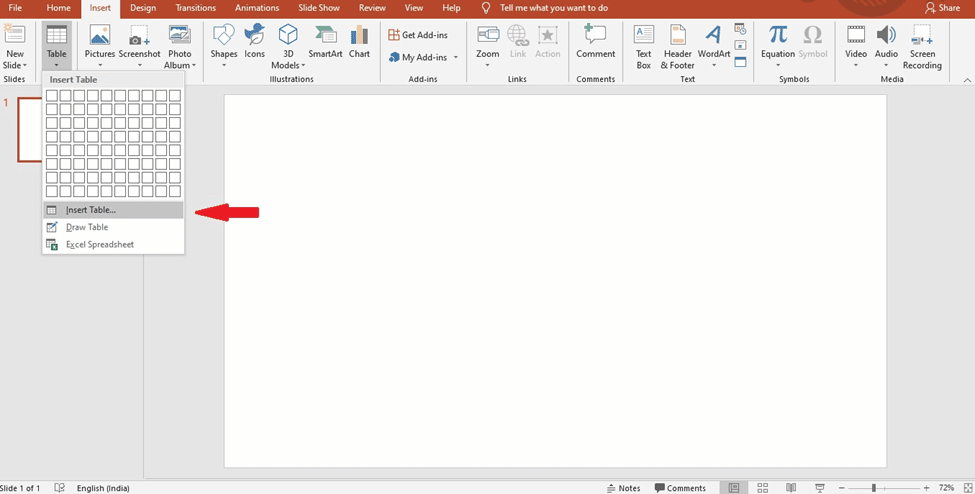
Step 2: Now, hover over the “Insert” tab and simply click on the “Table” button under the “Tables” group.
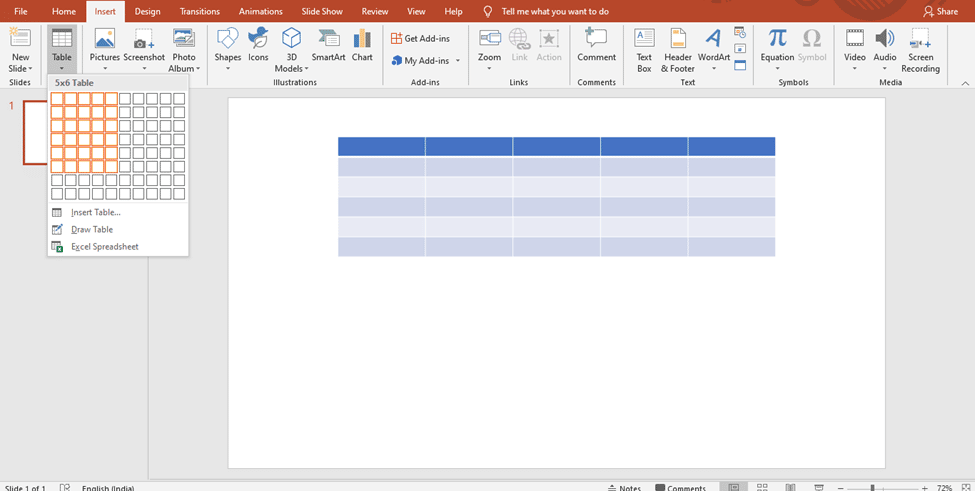
Step 3: A grid will appear, allowing you to choose the number of rows and columns you want to add in your table. Simply click on the desired number of rows and columns to create your table.
Step 4: Alternatively, you can also click on the “Insert Table” option under the “Tables” group to open a dialogue box where you can manually enter the number of rows and columns you want to add in your table.
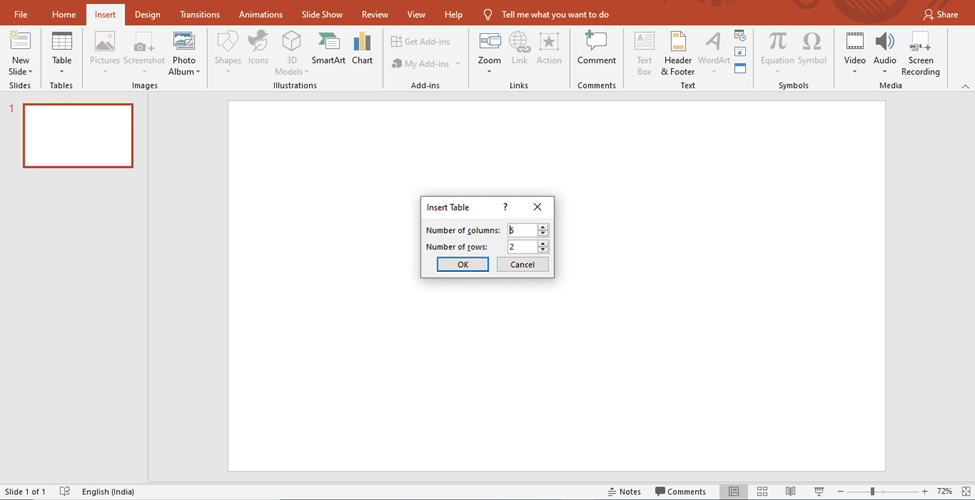
Step 5: Once your table is created, you can start entering data into the cells. You can also customize the appearance of your table by adjusting the font size, font color, cell borders, and more.
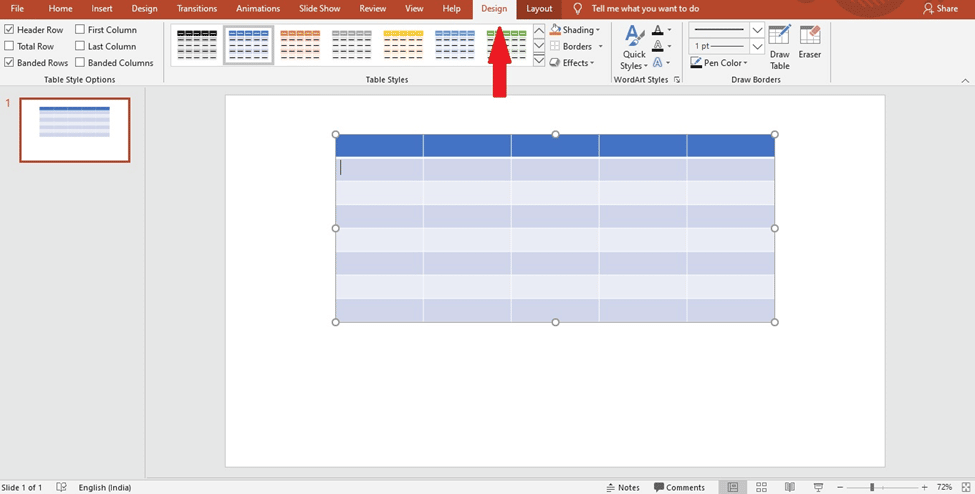
How to format the style of a table in PowerPoint?
To format the style of a table in PowerPoint, follow these steps:
Step 1: First, select the table you want to format by clicking on it.
Step 2: Next, go to the “Design” tab under “Table Tools” on the ribbon.
Step 3: In the “Table Styles” group, you’ll see a range of pre-designed table styles to choose from. Simply click on the style you want to apply to your table.
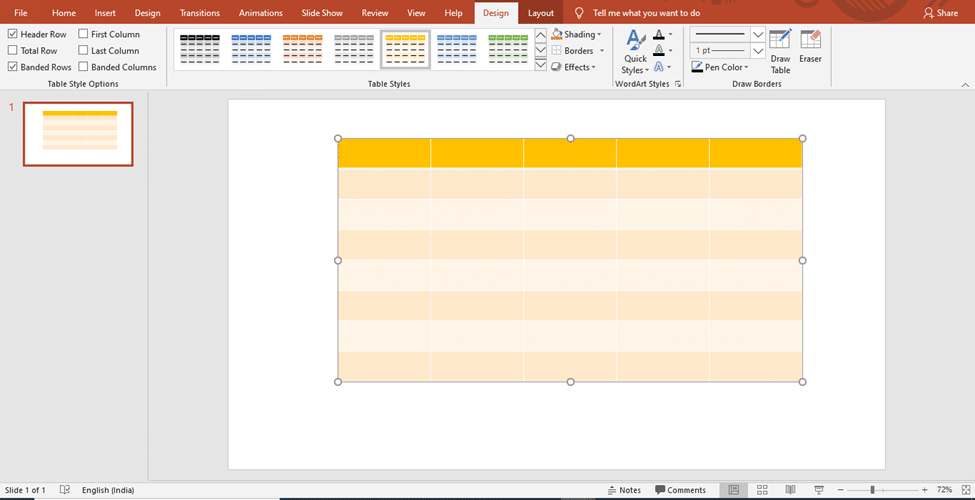
Step 4: The selected table style will be applied to your table immediately. You can preview different styles by hovering your mouse over them before making a final selection.
Step 5: If you want to create a custom table style, click on the “More” button in the “Table Styles” group to open the “Table Style Options” dialog box. From here, you can choose which elements of the table you want to format, such as the first row, last column, and more.
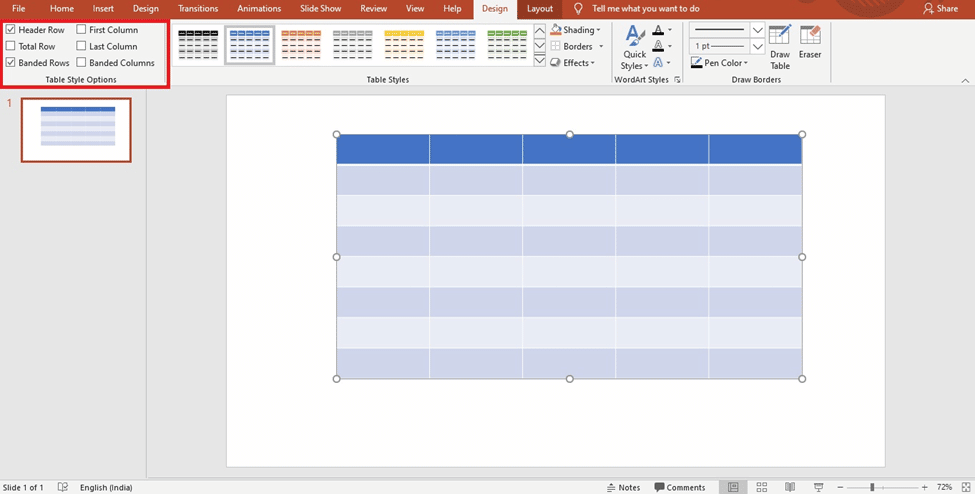
Step 6: You can also use the options in the “Table Styles” group to format specific elements of the table, such as the font size, font color, and cell borders.

How to add a row to a table in PowerPoint?
To add a row to a table in PowerPoint, follow these steps:
Step 1: First, select the table by clicking on it.
Step 2: Right-click on the table and select “Table” from the dropdown menu.
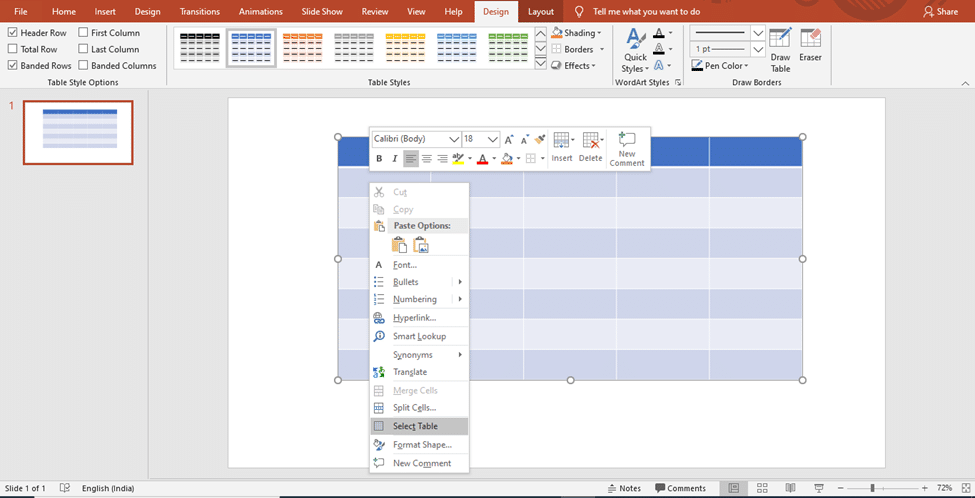
Step 3: In the “Table” menu, select “Insert” and then choose either “Rows Above” or “Rows Below”.
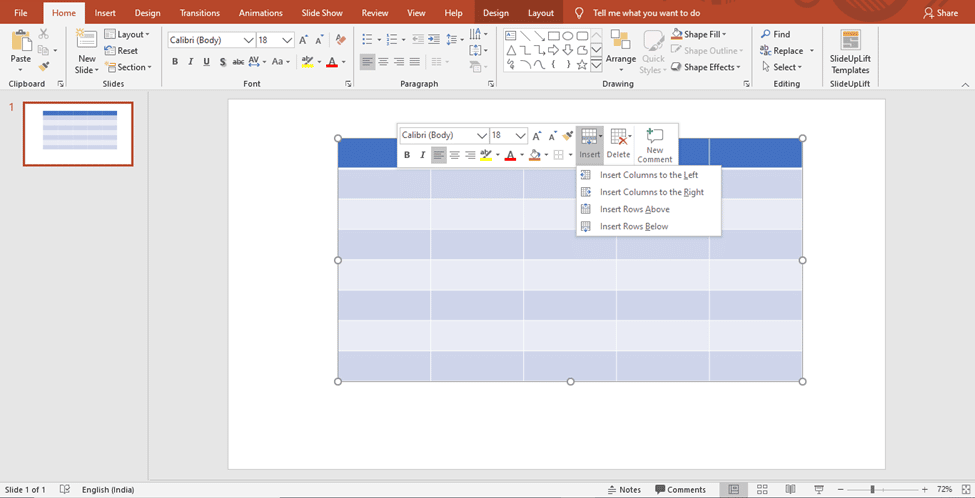
Step 4: A new row will be added to the table immediately.
How to animate a table in PowerPoint?
To animate table in PowerPoint, follow these steps:
Step 1: First, select the table by clicking on it.
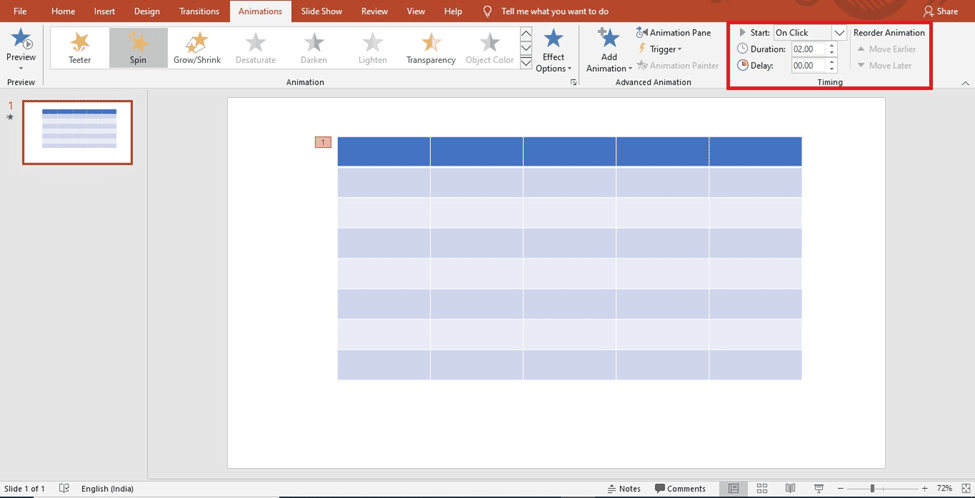
Step 2: Next, go to the “Animations” tab in the ribbon at the top of the window.
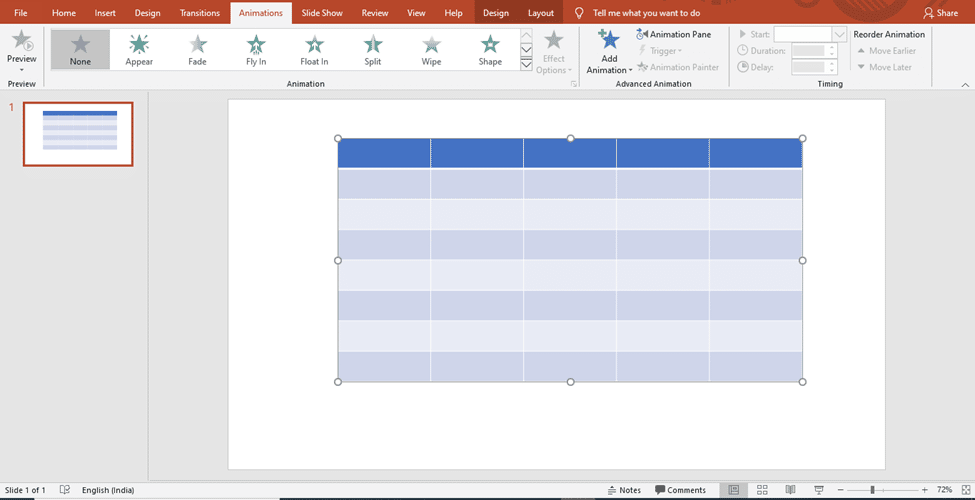
Step 3: In the “Animation Pane” group, click the “Add Animation” button.
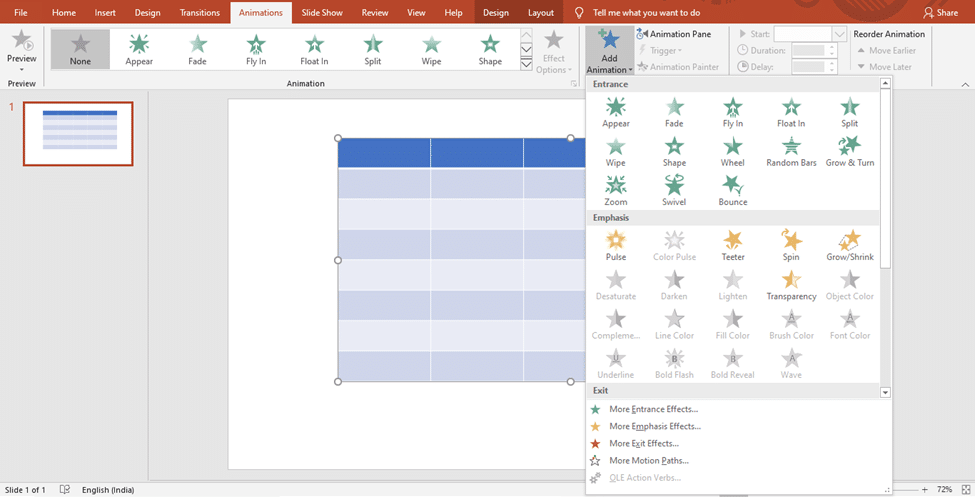 Step 4: In the “Add Animation” dialog box, select the animation effect that you want to apply to the table from the “Effect” dropdown menu.
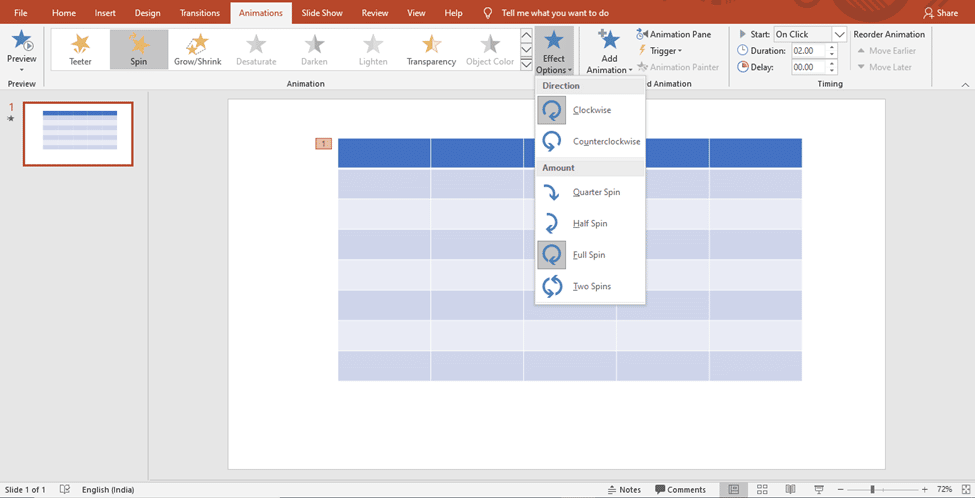
Step 5: To set the timing for the animation, click the “Start” dropdown menu and select the desired option.

Step 6: Click “OK” to apply the animation.
Explore 100+ Animated PowerPoint Templates For Your Presentation
Wrapping It Up
Creating a table in PowerPoint is a simple and useful tool that can help you organize and present information in a clear and concise manner. Whether you are using PowerPoint for a business presentation or a school project, tables can help you effectively communicate your message and make your presentation more visually appealing.
By following the steps outlined in this blog, you can easily create and customize a table in PowerPoint to fit your specific needs. Whether you want to insert row in PowerPoint table, format the cell contents, or apply a table style, PowerPoint provides a range of options to help you create professional-looking tables quickly and easily.
Looking For Powerpoint Design Agency?
Call Pursho @ 0731-6725516
Telegram Group One Must Follow :
For Startups: https://t.me/daily_business_reads
#Table #PowerPoint

