As of October 2019, Trello had a whopping 50 million users, and according to the platform, more than 80% of the Fortune 500 is using Trello for productivity. It’s undeniably a leading tool for collaboration, letting users seamlessly organize projects into boards. From there, users can see what’s being worked on at a glance and the progress of tasks.
Within the Trello platform, users can choose from add-ons called Power-Ups to enhance how they use it. For example, users can use Power-Ups to add-on alerts, time tracking, voting systems, and reporting.

In this article, we’re going to dive into one of the best reporting Power-Ups on Trello: Blue Cat Reports.
Who Is Blue Cat Reports?
Blue Cat Reports was created by the same team behind Corrello, which offers stunning dashboards for Scrum and Kanban teams on Trello. With more than a decade of experience, the team at Blue Cat Reports wanted to create something that would yield simple yet very effective insights for Trello users.
Together, their team worked to create an analytics tool that is easy to use, streamlined, convenient, powerful, and made just for Trello collaboration.

What Does Blue Cat Reports for Trello Do?
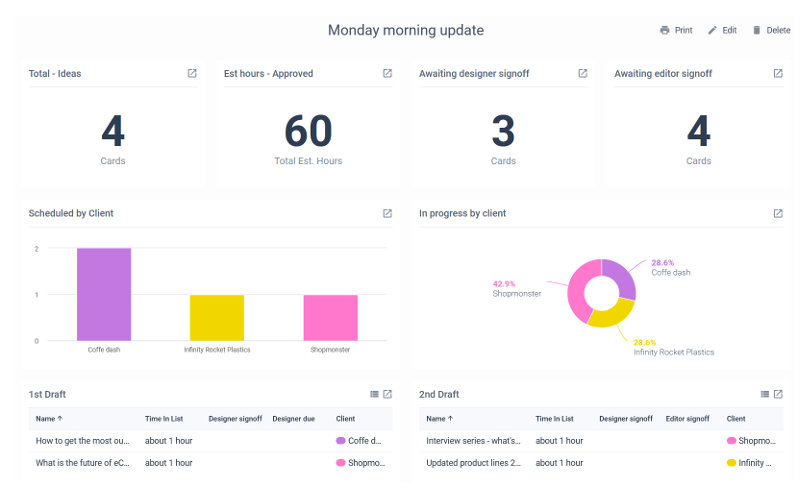
There are many, many Power-Ups to be found on Trello, and Blue Cat Reports certainly isn’t the only one made for reporting. It is, however, among the most popular ones. Blue Cat Reports for Trello lets users begin with an empty report and add components as needed.
Users can choose what data they want to see, and the drag and drop interface makes navigation a breeze. With past performance, data such as user reviews can be analyzed to create reports.
Reporting can be as simple or as technical as users want; it’s up to them. Features include items such as charts (both pie and bar graphs are available), historical charts, dimple number counts, lists of cards, and much more.
Blue Cat Reports: Pros and Cons
So far, Blue Cat Reports for Trello has been chosen by more than 5,000 Trello users for managing data. It’s a beautiful and sleek platform, making it alluring from the first time you see it. If you love visuals, you’ll enjoy Blue Cat Reports because it does such a wonderful job of creating visual representations of your data with just a few clicks.
Another thing we really appreciate about Blue Cat Reports for Trello is that we can keep things simple, if we want, or we can ramp up reporting and create more in-depth charts, graphs, and other visuals. We really enjoy being able to create reports for team meetings, managing workflows, and more, and being able to manage everything in one place. The list of cards feature is simply exceptional: just create a list choose the filters you want, and enjoy simple searching.
Overall, we think Blue Cat Reports offers perhaps one of the strongest ways to analyze and improve workflow processes. If you’re looking for an opportunity to up your game, this might just be it.
There are few caveats that we could find in Blue Cat Reports for Trello, mostly because this is a very niche app. Still, we think in the future, a few improvements would only yield a better, more seamless experience. We look forward to seeing new imagery options for reporting and perhaps a few new features to build out the platform a bit.
Data and analytics is such a big market, we think Blue Cat Reports for Trello will be around for a long time. We really can’t say anything bad about this app!
Conclusion
If you’re on Trello, then you are obviously managing a team. You could likely benefit from improving your workflow, and Blue Cat Reports for Trello understands this need. They have worked to create a seamless platform where you can get the insights you need to make the changes that will bring your teams higher success.
If you have been looking for a way to get the most from your workflow and smooth out any issues you might be having, then give Blue Cat Reports for Trello a try.


