30-second summary:
- A typical consumer now owns an average of 3.6 devices which means a person’s journey may start from a laptop and end on a mobile or a tablet.
- In the ecommerce business, the cart abandonment rate is the thing that haunts most of the business owners.
- Developing analytical skills can help you better manage these obstacles.
- MD of SEO Discovery shares a guide to help you understand Cohort Analysis and Behavior Analysis to eliminate roadblocks and improve engagement.
In today’s digital age, the customer journey is getting complex day by day and if you are doing online business then it’s vital to understand your customer journey. A typical consumer now owns an average of 3.6 devices which means a person’s journey may start from a laptop and end on a mobile or a tablet.
In the ecommerce business, the cart abandonment rate is the thing that haunts most of the business owners. According to Statista, 88.05 percent of online shopping orders were abandoned in March 2020 worldwide, which means over 88% of people added selected products into the cart and left without buying for various reasons. This is a massive business opportunity loss for ecommerce players.
Developing analytical skills can help you better manage these obstacles. Without adequate knowledge of analytics, your marketing won’t work because you won’t know what worked and what didn’t work. All the marketing suits come with analytics tools to help perceive the behavior, engagement metrics, and demographics of the visitors coming to a website. The most common web analytics tools are Google Analytics, Adobe Analytics, Kiss Metrics, and Mixpanel. They generally come with the following features and capabilities:
- Real-time analytics
- Mobile analytics
- Attribution modeling
- Segmentation
- Ecommerce tracking
- Funnel analysis
- Cohort analysis
- Cross-device tracking
- In-page analytics (Session recording, click tracking, heatmaps)
- Goal conversion tracking
- Event tracking
- A/B testing
Every feature has its own data sets which can be compared to help you make informed decisions. Today we are going to understand Cohort Analysis and Behavior Analysis to eliminate roadblocks and improve engagement.
What is a Cohort Analysis and why is it important?
Cohort analysis is a subset of users grouped by shared characteristics. It simply allows you to compare the behavior and metrics of different cohorts over time.
Cohort Analysis Example – Finding Engagement Drop
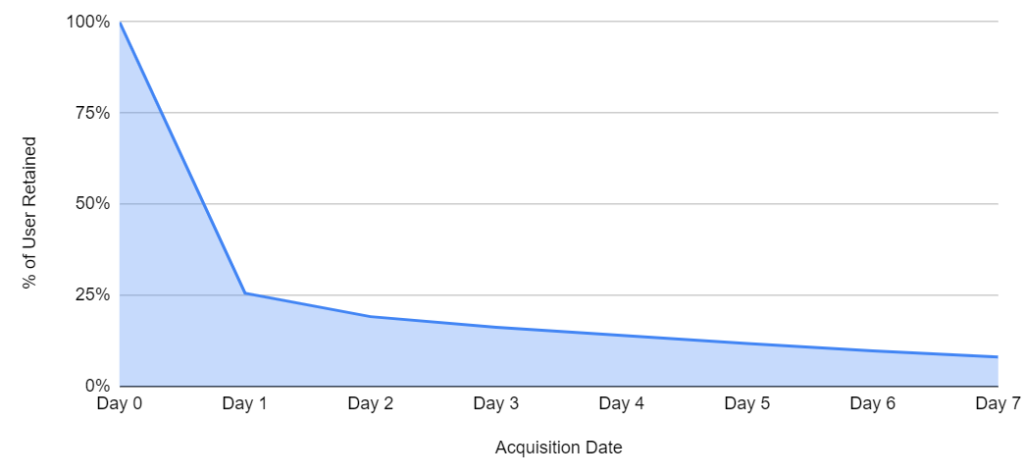
Let’s suppose you have an online food ordering website/app and using acquisition date (when users started their first sessions) cohorts you can find out when in the customer lifecycle your users tend to drop off.

The best way for visualizing this data is to chart out the retention curve, portraying retention over time.

This retention curve clearly reflects the most important insight – around 75% of the users stop using the website after the first day. We can see a downfall in the engagement. Hence, it’s evident to improve the overall experience and abet customers through daily offers/coupons to boosting retention.
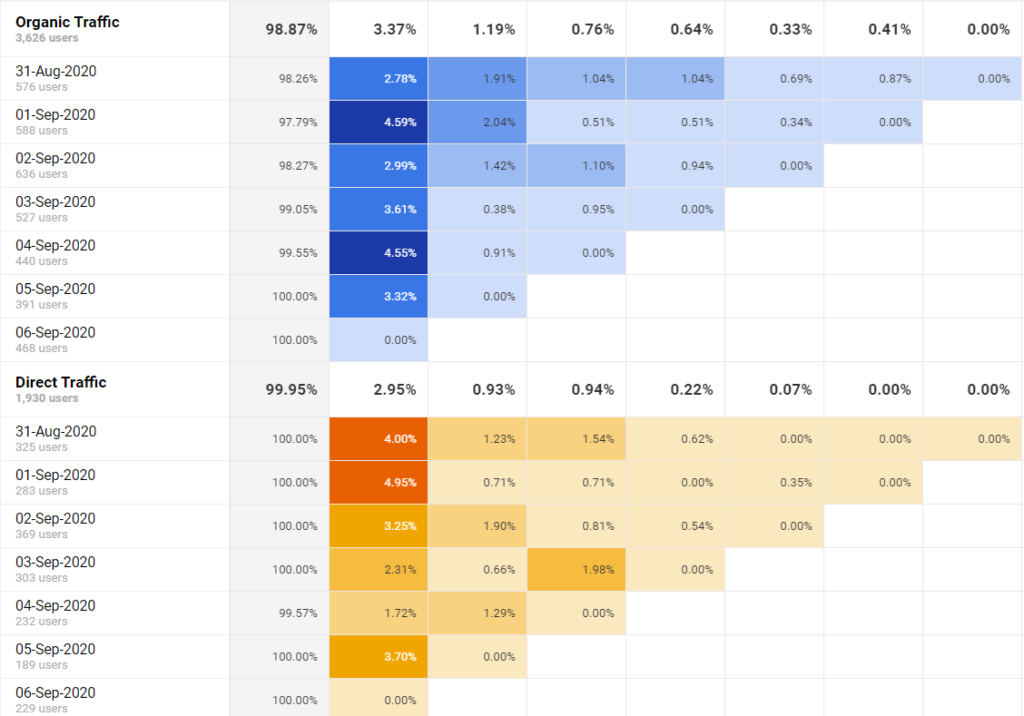
Cohort Analysis Comparison – Organic vs Direct
The below cohort analysis indicates that organic traffic has a better retention rate than direct.

Visitor behavior analysis and its importance
It’s a process of tracking user behavior on a website and there are some great tools in the market that give accurate information. Tools like Hotjar, MouseFlow, Crazy Egg record visitor sessions to see how visitors are navigating on the website. They also offer click tracking and heatmaps to analyze the most engaging and ignored (skipped) elements on a page.

If you look at the above heatmap, you would notice that no one bothered to click on “PORTFOLIO” in the top menu, which means people aren’t interested in see the portfolio. Maybe we have to replace it with something more interesting (like Case Studies, Achievements, and more) which grabs a visitor’s attention. These kinds of insights help you add/remove elements to improve page engagement.
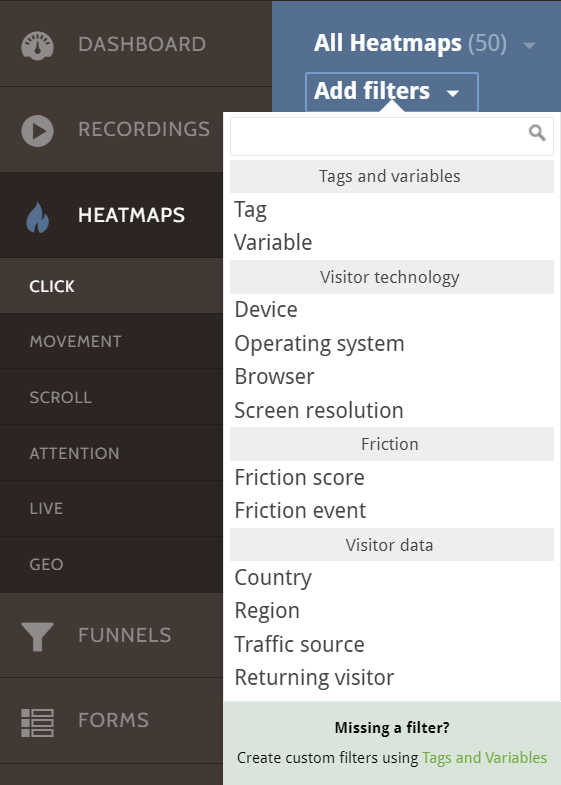
Using filters, you can further segment your audience to dig deep and pull out actionable insights, see those filter below:

In Google Analytics, behavior flow gives you a visual presentation of how people are navigating on your website. You can apply segments to get a deeper view of their behavior and it also enables you to apply different dimensions on top of these segments to get actionable insights.

The power of these analytical tools lies in the fact that it allows you to view which customers leave and what’s making them leave your website/app – so that you can fix it. You can also hire a professional digital marketing agency that can help you find these hurdles and remove them to enhance your overall engagement.
Mandeep Singh is the MD of SEO Discovery. He’s mission is to provide affordable digital marketing services to startups and SMEs. He’s an official member of Forbes Agency Council. You can find him on LinkedIn.


