Search engine optimization relies on the ability to measure performance. Google Analytics can make the task easier. What follows are seven tips to help.
Measuring Organic Search
1. Add an annotation. It’s important to know the cause of peaks and valleys in your analytics months or years after they occurred. Annotations in Google Analyitcs can help.
For example, did the pandemic crater your traffic and revenue on the week of March 15, 2020? Did your Memorial Day sale increase orders significantly? Without a note, you likely won’t remember the cause of these anomalies six months from now. Your annotations are marked in the horizontal timeline of the chart with a chat-type icon. Click that icon for the details.
Make an annotation in any report by clicking the down arrow below the chart’s horizontal (timeline) axis and then click “Create new annotation.”
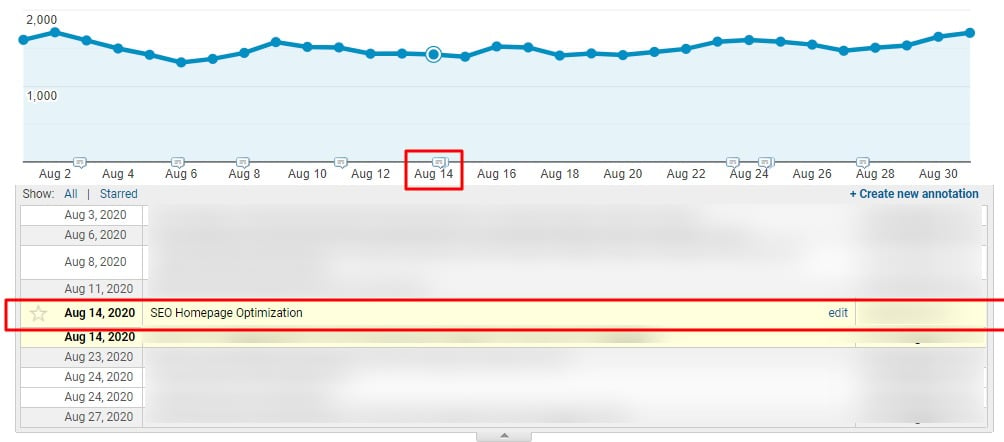
Click an annotation icon in any chart for the details. Click image to enlarge.
2. Save your favorite reports to reduce the time to assemble the exact combination of segments, dimensions, and metrics. For example, I rely on the organic search channel report (Acquisition > All Traffic > Channels > Organic Search) with the dimension for landing pages applied and with the chart showing sessions instead of users. I want to see as many pages as possible, so I set the page range to 5,000. That’s seven clicks and five page loads to see a basic report. Saving it results in three clicks and two page loads.
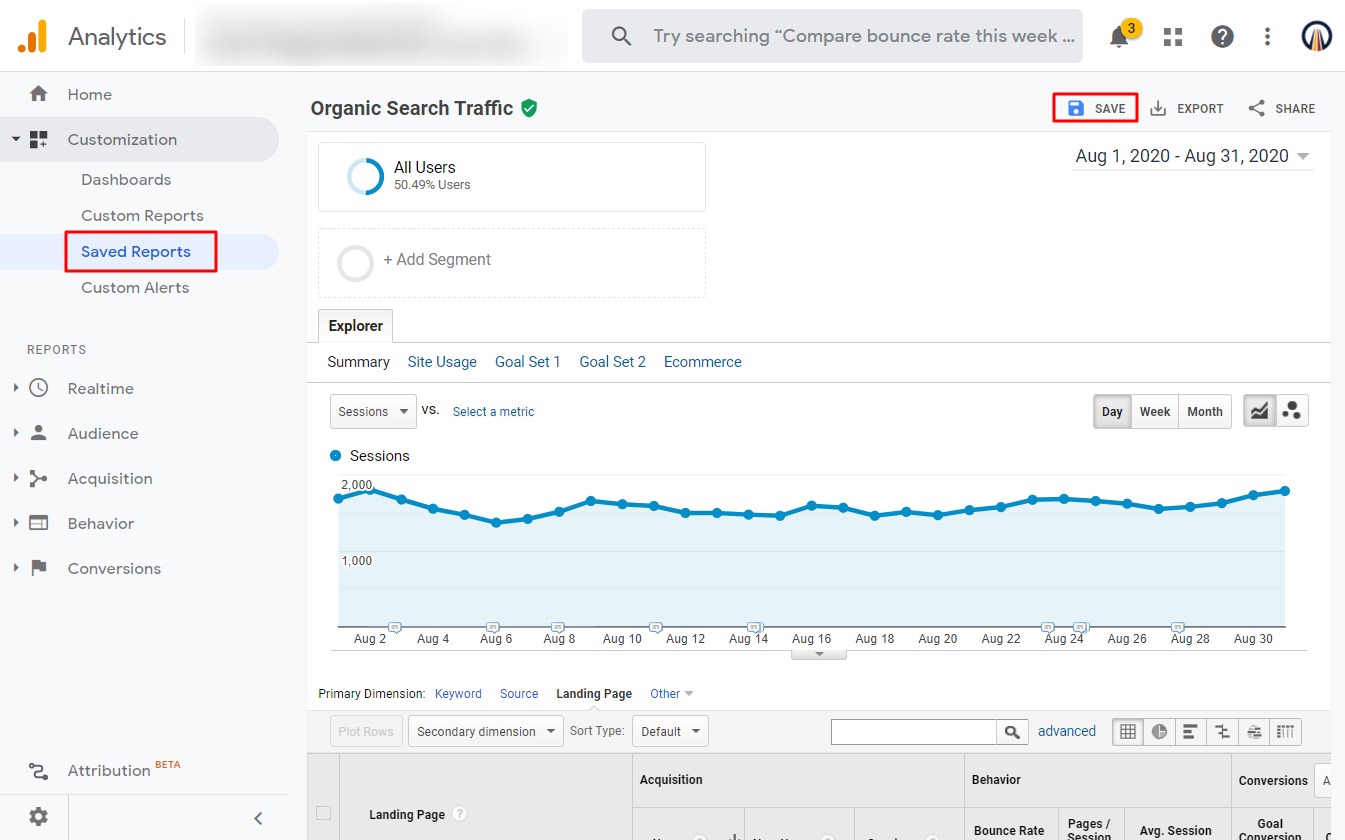
Saving your favorite reports reduces the number of clicks to access. Click image to enlarge.
3. Create segments for page sets. Measure subsets of pages you’ve optimized by creating a segment. You can then compare that segment to the performance of all organic search landing pages. You’ll know, for example, whether the increase in the page set you optimized is as large as the site’s overall trend in organic search.
Segments are also helpful for comparing the performance of different page types — product detail, browse grids, parent landing pages — as well as audiences, channels, devices, search engines, or anything else you’re interested in tracking against other segments in a single view.
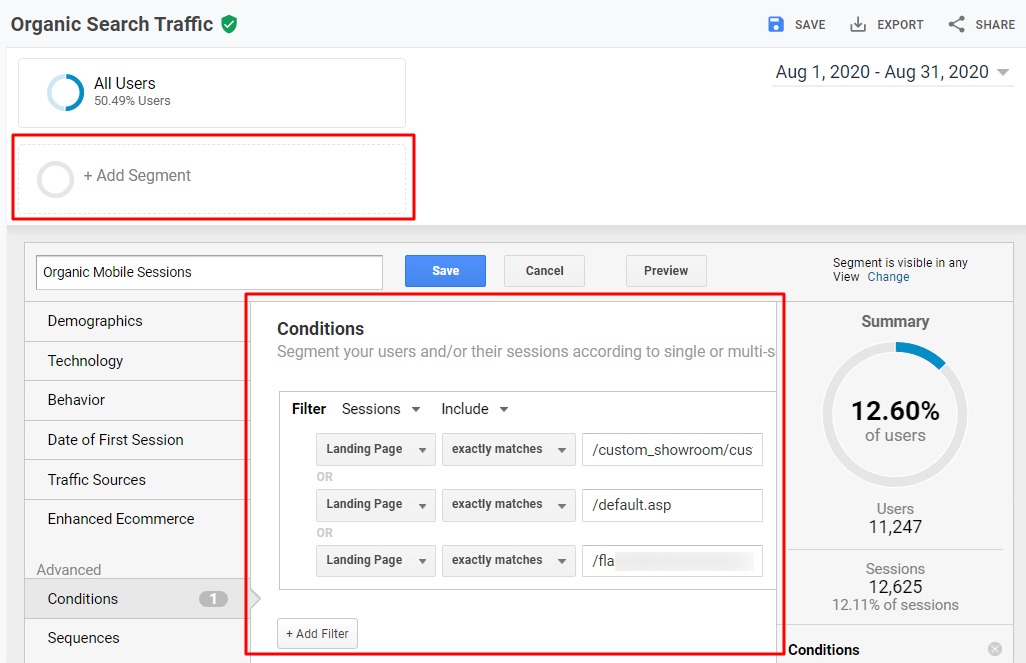
A segment can compare a set of pages optimized for organic search against the performance of the site overall. Click image to enlarge.
4. Use regular expressions to identify patterns of data within search fields, which is essentially what Google Analytics filters are. Using regular expressions in filters enables you to be extremely precise in targeting a set of pages.
For example, you could use regex in Google Analytics when creating a segment for all landing page URLs that contain /page or /info. You could otherwise use two basic filters to do the same thing, but there’s a limit to the number of filters to apply at once. But regex can populate one filter with many pages or patterns in a single search string. The regex syntax defines how to form your strings. You apply that syntax to your list of URLs or whatever you want to measure. Check the Google Analytics help center for a list of the regular expressions it supports.
5. Create custom reports. Saved reports create shortcuts to access. You can apply filters and segments within the saved report, but it still shows the same metrics in the same configuration. Custom reports allow you to break out of the predefined shells and aggregate only the combinations of dimensions and metrics you want (within limits).
6. Build your own dashboard. Dashboards are a single place to view trends of key performance metrics. For example, the simple dashboard below shows three metrics — sessions, revenue, transactions. All of these are in standard performance reports. However, the dashboard shows a year-over-year chart for each metric rather than just two clumped together. Also, the sample dashboard includes a pie chart showing the organic-search source, and other charts below that.
You can create multiple dashboards for different aspects of your SEO program or for other people within your organization. The visual options are limited, however. When you outgrow those limitations, give Data Studio a try.
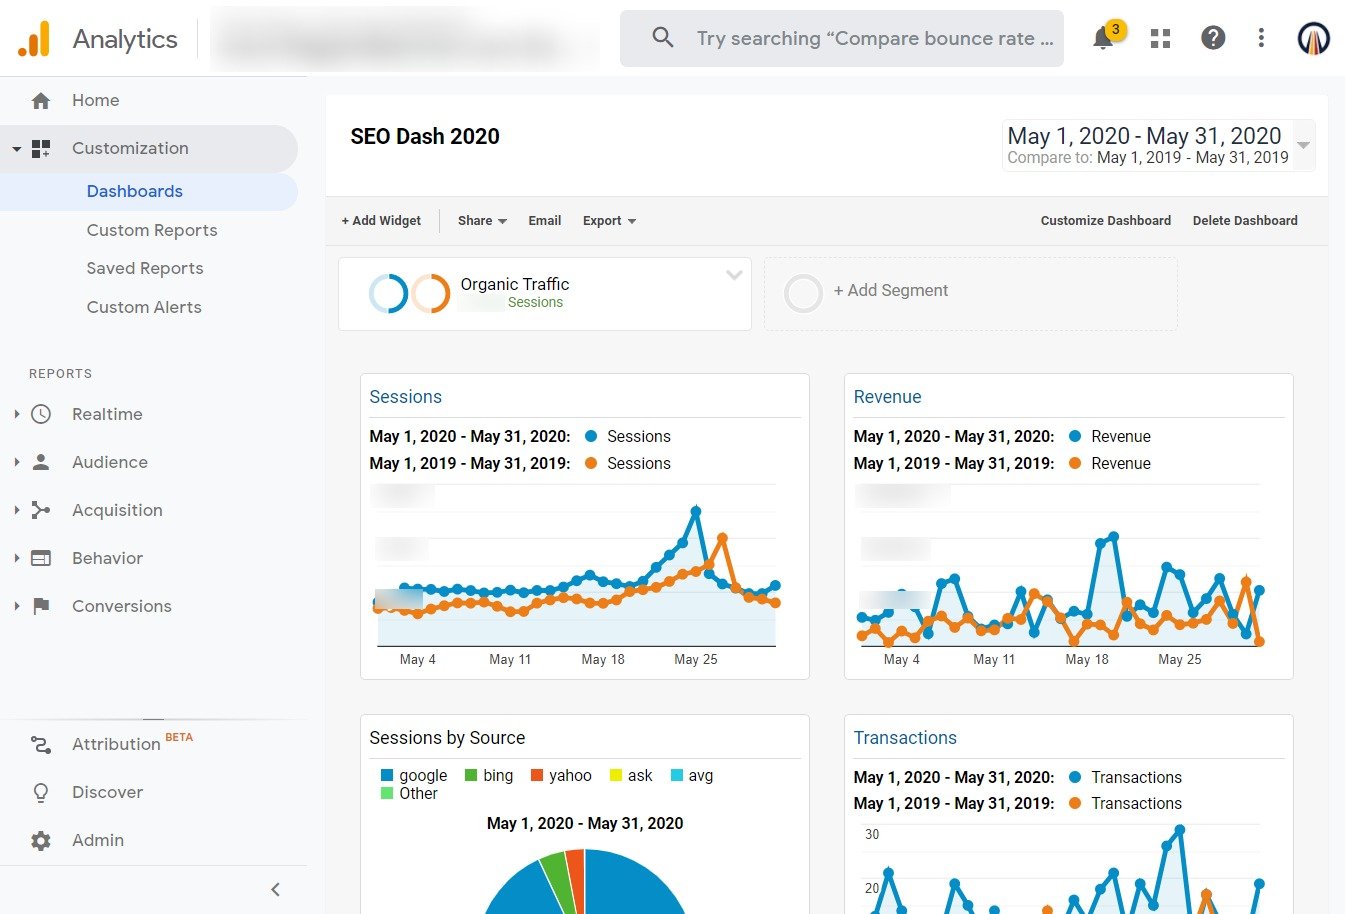
Dashboards aggregate key metrics into a single view. Click image to enlarge.
7. Import Google keyword data. A report is only as good as the data behind it. Organic search keyword data has been unavailable for years, as most queries strip out the referrer for secure search. You can, however, supply more accurate keyword data to Google Analytics by linking to Google Search Console. That data also includes ranking position, impressions, and Google’s landing page. You’ll know how searchers see your organic listings and which pages they see next.
It’s much easier to set date ranges, filter, and export the data to Google Analytics than in the native Search Console interface. Plus, you can save your Google Analytics reports for easy access.

