Expanding into international markets presents opportunities and challenges for ecommerce companies. One challenge is to report the return on advertising and revenue in each country and overall. Adding multiple currencies to the mix complicates the effort.
Google Analytics can combine multiple currencies into one. Google explains in an Analytics Help post how to include the currency field in the ecommerce tracking code to convert currencies into the default currency setting.
Google Analytics’ conversion of currencies is straightforward. However, setting the conversion date to equal the date of the transaction may not be an option, forcing merchants to convert currencies manually. Google Data Studio’s ability to blend data sources can solve this manual conversion hurdle.
Adding multiple currencies to the mix complicates the effort.
Data Studio
In a post last year, I introduced blending data sources in Data Studio. That example blended SKU costs on a Google Sheet with SKU sales in Google Analytics.
For this currency conversion example, I have created another Google Sheet that lists the U.S. dollar conversion amounts for prominent world currencies. We can then use that conversion data in Data Studio to convert from U.S. dollars to other currencies and vice versa. I’ll assume we’ve advertised on Facebook, and we’re converting that ad spend from dollars to euros.
The first step is to add the data sources in Data Studio. For this example, the sources are the currency-conversion Google Sheet and data from Facebooks Ads.
In the screenshot below, I am blending data from Facebook Ads and my Google Sheet, to convert from dollars into euros. I have used the “Date” as a “Join key” for both data sources. The metric I’ve chosen from the Facebook data is ad “Spend.” The metric from the Google Sheet is “Euro” as our goal is to convert Facebook dollars into euros.
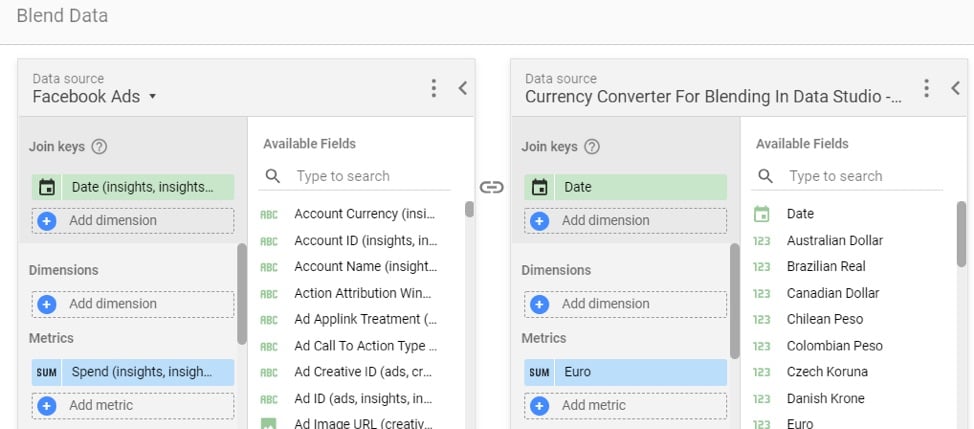
In Google Data Studio, blend data from Facebook Ads and the Google Sheet, to convert from dollars into euros. Click image to enlarge.
—
After saving this blend, I’ve included the date of the ad spend and renamed three other metrics.

Include the date of the ad spend (at left) and rename three metrics: “Spend in Dollars,” “Euros/Dollar,” and “Spend in Euros.” Click image to enlarge.
The three name clarifications are:
- “Spend in Dollars.” I renamed the “Spend” metric to “Spend in Dollars” to clarify the currency, which also injects the dollar sign. We can rename metrics in Data Studio by clicking to the left of the name.

Rename metrics by clicking to the left.
—
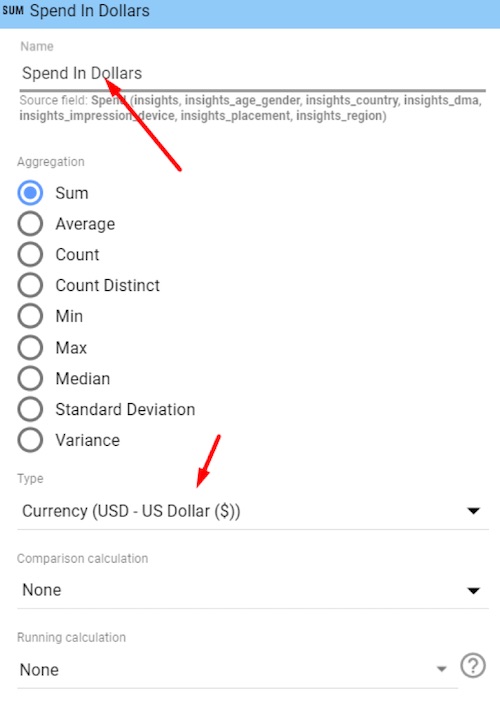
Selecting the currency also injects the dollar sign.
- “Euros/Dollar.” I renamed the “Euro” field to “Euros/Dollar” to be more descriptive. This field is the conversion factor between dollars and euros. It can be omitted from the report, but I included it for more detail.
- “Spend in Euros.” I created this new calculated field using the following formula:
Spend in Euros = sum(Spend)*avg(Euro)
The formula multiplies Spend times the euro conversion factor. I wrap Spend in “sum” as Data Studio requires it. I wrap euro in “avg” in case I include a summary row from the bottom of my table. You could also wrap in “sum” to produce this formula:
Spend in Euros = sum(Spend)*sum(Euro)
Be aware, however, that if you are using a table and include a summary row, the summary value will be off for this column.
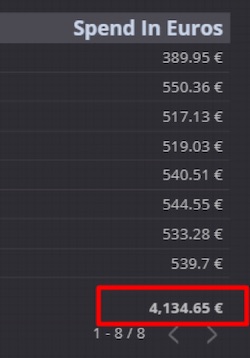
Accurate summary row reporting when using “avg(Euro).”
—
If I had used “sum(Euro),” the individual rows would calculate correctly, but the summary row would be off.
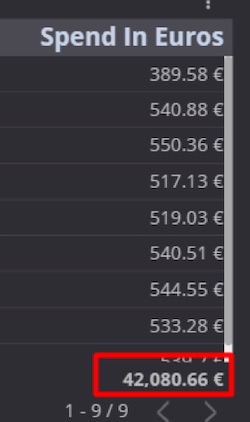
Accurate summary row reporting when using “sum(Euro).”
–
Also, modify the field from a number to currency — euros in this case.
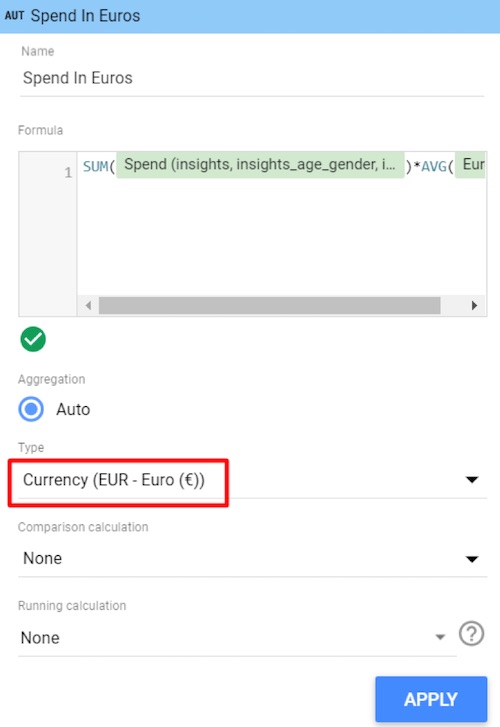
Modify the field from a number to currency — euros in this case.
One Currency
With the new currency conversion process, we can assemble all sales and advertising spend data into one local currency for performance analysis.

