Managing Google Ads can be a daunting task, even for experienced practitioners. The user interface includes two columns of left navigation, 25 links in the “Tools & Settings” area, and the primary workspace with a two-variable performance graph and table.
With those options and data, it’s vital that advertisers sort out the noise. One underused method is to filter the view.
What Are Filters?
The concept of filters is likely familiar to spreadsheet users. The goal is to limit the amount of data presented in the main table by a predetermined set of conditions. For example, we can use filters to show all campaigns that contain (or not) a specific word or phrase, or only keywords with conversions in the past seven days.
Filters can be applied to virtually any reporting column in Google Ads. The date range appears separately in the upper right corner.
Filters save time. Instead of scrolling through row after row of data, we could apply filters to show only the most important info. We could then prioritize by sorting the key column. We could also use bulk filters, to all selected rows.
In short, filters allow advertisers to analyze and act on the critical data, to improve results.
My 3 Favorite Filters
I routinely use three specific filters. They apply to all companies, regardless of industry, objectives, or budget.
Poor Placements. This filter is for any campaign utilizing the display network or YouTube. To use, navigate to a specific campaign, choose “Where Ads Showed” at the top, set the date range, and apply the desired conditions.

The “Poor Placements” filter is for any campaign utilizing the display network or YouTube. Click image to enlarge.
I rely on the Poor Placements filter to remove any site that doesn’t contain .com, .org, .net, or .co.uk. (Any top-level domain can be filtered.) This will list all otherwise suitable mobile apps, YouTube channels, and websites with obscure TLDs. I can then check the button for all placements and exclude them from the ad group or the campaign (my preference).
A further refinement is to filter for conversions that are greater than a set percentage. This ensures I’m not excluding placements that generated strong conversions or including under-performing ones. I’ve seen this filter prevent wasted ad spend of 10 percent or more.
Close Variant. Google is increasingly aggressive with keyword matching. The Close Variant filter is handy for reporting the queries that show your ads. To use, navigate to the campaign, select keywords from the left menu, choose search terms at the top, and set the date range.

The “Close Variant” filter is handy for reporting the queries that show your ads. Click image to enlarge.
I’ve set “Added/Excluded” to “None” and the “Match type” for “Exact match (close variant)” and “Phrase match (close variant).” This will ensure it’s not a keyword I already have and, also, it applies to my exact or phrase match keywords.
Notice the row of performance data at the bottom of the screenshot above. The average cost/conversion on this group of queries is $353.11. Conversely, the average cost/conversion for this account overall (not shown) is just over $260. Thus to lower the cost/conversion for this group, we can add negative keywords to rein in Google’s matching.
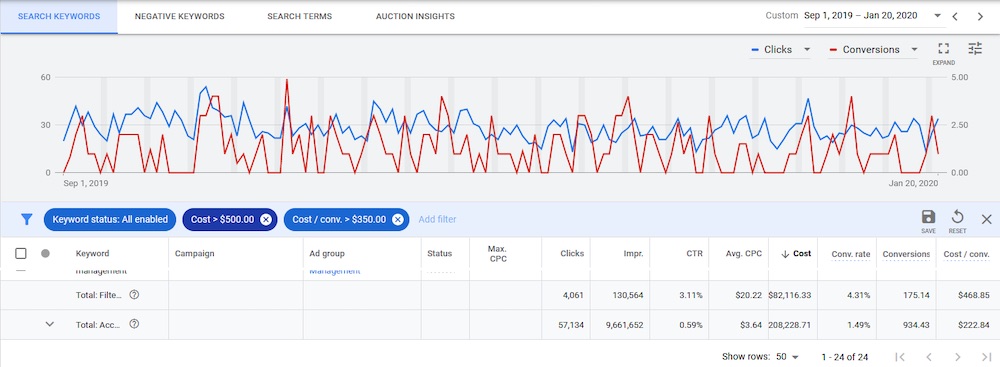
“X” Spend, “X” CPA Keyword. This is technically four filters because we can insert either “High” or “Low” for each variable. The screenshot below illustrates high spend, high cost-per-acquisition keywords over roughly five months.

“‘X’ Spend, ‘X’ CPA Keyword” is technically four filters because we can insert either “High” or “Low” for each variable. Click image to enlarge.
To switch between high and low, we flip the inequality symbol from > to < or vice versa. Then we set the dollar amounts for our account. I usually choose a cost/conversion that is around 150 percent of average and spend that is about 2-times the cost/conversion.
The four filters reveal:
- High Spend, High CPA. These keywords are prime candidates for bid decreases or pauses, depending on the severity.
- High Spend, Low CPA. These are our top-performing keywords. Analyze impression share to get more mileage.
- Low Spend, High CPA. These keywords creep up, especially over longer timeframes. Look for queries matching these keywords for potential negatives to add. Alternatively, pause them.
- Low Spend, Low CPA. These could be growth opportunities. Consider higher bids to increase impression share and visibility.
Saving Filters
I always name the filters and save them, though they’ll be available only in that specific view. Nonetheless, it saves even more time.


